Automating antibody titration using a CytoFLEX LX analyzer Integrated with a Biomek i7 Multichannel workstation and Cytobank streamlined data analysis
Introduction
Flow cytometry is an important research tool for rapidly characterizing cell populations in suspension. Advances in instrumentation and fluorescent reagents have made it possible to perform flow cytometry experiments in a high-throughput manner. Many flow cytometry research protocols use fluorescently labeled antibodies to either measure protein expression or identify cell types within a heterogeneous population. Determining the correct concentration/titer of antibody to use in a given experiment is a critical quality control parameter. Using too little antibody can result in incomplete labeling, whereas using excess antibody can lead to increased background fluorescence and binding of antibody to low-affinity sites.
As performing antibody titrations can be laborious, time consuming and prone to human error, we sought to automate this procedure using a Biomek i7 Multichannel workstation integrated with a CytoFLEX LX flow cytometer (Figure 1). The Biomek i7 Multichannel workstation is an automated liquid handler that is capable of efficiently performing the complex liquid handling steps of flow cytometry workflows, including antibody titrations. This minimizes the number of required user interactions and increases walk-away time, freeing the operator to attend to other research tasks.
We further streamlined the workflow for antibody titrations using the Cytobank software platform, which can perform both data analysis and Stain Index (SI) calculations within one program. Historically, this step often requires flow cytometry data analysis in one software program with export of statistics to another program for Stain Index computations and graphical representation of the antibody titration results.
We present here an automated and streamlined workflow for antibody titration experiments using laboratory solutions available from Beckman Coulter Life Sciences (Figure 2).
|
A
|
B
|
C
|
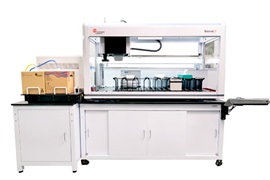
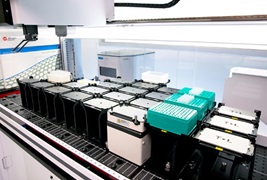
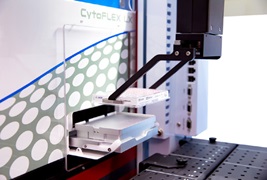
Figure 1. A) *Biomek i7 Multichannel workstation with Integrated CytoFLEX LX Flow Cytometer. B) Biomek i7 Multichannel workstation deck with the integrated CytoFLEX LX flow cytometer. C) An enhanced view of automated loading of a 96-well plate into the CytoFLEX LX flow cytometer with the Biomek gripper.
*For Research Use Only. Not for use in diagnostic procedures.

Figure 2. Automated and Streamlined Antibody Titration Workflow. Automated steps using the Biomek i7 Multichannel workstation integrated with the CytoFLEX LX flow cytometer. Time estimates for serial dilutions of three antibodies, and cell staining using eight concentrations (24 wells total), are shown below each step in the workflow diagram. Streamlined data analysis and Stain Index (SI) calculations are performed using Cytobank software.
Materials and Methods
PBMC Sample
Normal human Primary Peripheral Blood Mononuclear Cells (PBMC) were purchased commercially from ATCC (cat# PCS-800-011), thawed, washed two times and resuspended using RPMI-1640 media supplemented with 10% FBS. Cell concentration and viability were then assessed using DURAClone IM Count Tube. PBMC sample cell concentration was then adjusted to approximately 10 x 106/mL in RPMI-1640 media supplemented with 10% FBS.
Reagents
| *Reagent | Supplier | Part Number |
| RPMI-1640 | HyClone | SH30255.01 |
| FBS (heat inactivated) | Gibco | 10082-147 |
| DURAClone IM Count Tube | Beckman Coulter | C00162 |
| PBS (1X) Buffer | Gibco | 10082-147 |
| Cell Staining Buffer | BioLegend | 420201 |
| ViaKrome 561 Fixable Viability Dye | Beckman Coulter | C36620 |
| Anti-human CD4-Pacific Blue | Beckman Coulter | A82789 |
| Anti-human CD8-APC | Beckman Coulter | 200065 |
| Anti-human CD19-Alexa Fluor® 700 (Alexa Fluor® 700 carboxylic acid, succinimidyl ester, tris [triethylammonium salt]) (A700) | Beckman Coulter | 200028 |
*For Research Use Only. Not for use in diagnostic procedures.
Biomek i7 Consumables
| Labware | Supplier | Part Number |
| Biomek i-Series, 90 µL pipette tip, sterile | Beckman Coulter | B85884 |
| Biomek i-Series, 230 µL pipette tip, sterile | Beckman Coulter | B85906 |
| Biomek i-Series, 1070 µL pipette tip, sterile | Beckman Coulter | B85945 |
| 96-Well U-bottom plate, polystyrene | Greiner Bio-One | 650101 |
| 96-Well Skirted PCR plate | Bio-Rad | HSP9601 |
Automated Antibody Dilutions
All necessary labware, reagents and samples were loaded onto the deck of the Biomek i7 Multichannel workstation as shown in Figure 3A. The antibody dilutions were performed by the Multichannel pod using a serial dilution step within the Biomek 5 software. Antibodies were serially diluted 2-fold in a 96W skirted PCR plate in cell staining buffer in a row-wise manner to achieve antibody concentrations ranging from twice the recommended concentration (2X) down to 0.03X. Between each addition of the serial dilution step, well contents were mixed three times before the next serial dilution step.
Automated PBMC Sample Staining and Washing
PBMCs were pipetted in 100 µL aliquots to designated wells of a 96W U-bottom assay plate. Next, 20 µL (2X) and 10 µL (1X) of each stock antibody was added to designated wells of the assay plate followed by 10 µL addition of each antibody serial dilution to designated wells of the assay plate. Samples were mixed on-deck by the orbital shaking automated labware positioner (ALP), covered with a foiled lid, and incubated on the Biomek deck for 15 minutes in the dark. Samples were then washed by pipetting 100 µL of cell staining buffer to each well and the assay plate was centrifuged at 1000 rpm for 5 minutes using the on-deck, integrated microplate centrifuge (Agilent). After cells were pelleted, 165 µL of the resulting supernatant was removed to achieve 45 µL residual volume. Next, 5 µL of ViaKrome 561 Fixable Viability Dye (FVD) dilution was added to each well in use, the plate was then shaken on the deck to mix the cell/dye mixture, covered with a foiled lid and incubated for 15 minutes in the dark. The cells were then washed (as above) by the addition of 150 µL of cell staining buffer, centrifugation, and the removal of 150 µL of the supernatant. The wash step was repeated using 200 µL of cell staining buffer per well. The final addition of 150 µL of cell staining buffer was then pipetted to each well, mixed using the orbital shaker and the plate was then automatically loaded into the integrated CytoFLEX LX flow cytometer with the Biomek gripper. Samples were acquired using a pre-programmed experiment in CytExpert software and acquisition of sample wells were monitored in real time using the Run Time Data Viewer (Figure 3B) on the Biomek controller computer monitor.
|
A
|
B
|
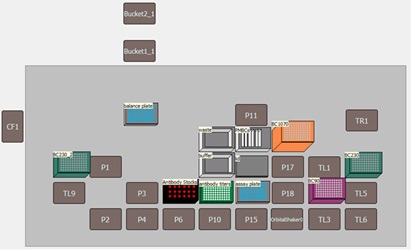
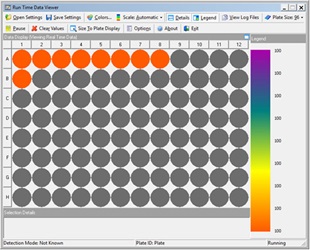
Figure 3. Automated Method. A) Deck layout for the automated method. Required equipment included the following ALPS, devices and integrations: 4 tip loading (TL) ALPs, 7 1x1 ALPs, orbital shaking ALP, microplate centrifuge (Agilent), and CytoFLEX LX flow cytometer. B) Automated flow cytometry sample acquisition was monitored on the Biomek controller PC using the Run Time Data Viewer.
Flow Cytometry Data Acquisition
Samples were acquired on the CytoFLEX LX flow cytometer using CytExpert acquisition software. PBMCs were gated using FSC vs. SSC dot plot and a region was drawn to encompass the lymphocyte population. LIVE and DEAD lymphocytes were gated using ViaKrome 561 vs. SSC dot plot with the lymphocytes gate applied and regions were drawn to encompass the LIVE lymphocytes (ViaKrome FVD 561 -) and DEAD lymphocytes (ViaKrome FVD 561+). A stop count was applied to record 30,000 LIVE lymphocytes from each sample well (Figure 4). Fluorescence was measured for each directly conjugated antibody using the appropriate detector matching the fluorochrome excitation and emission criteria.
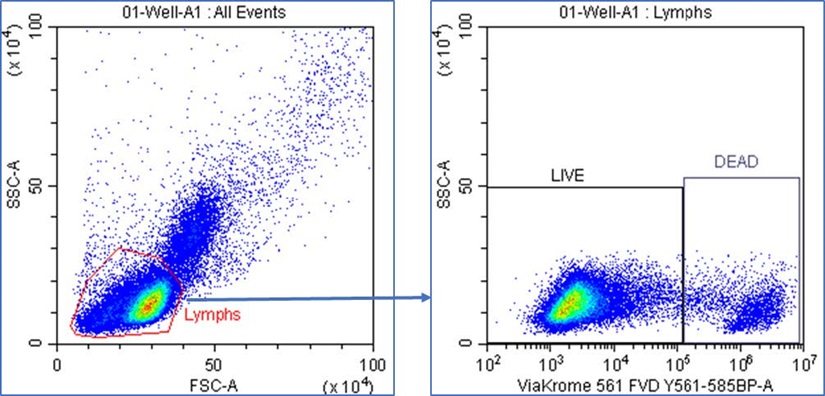
Figure 4. CytExpert Sample Acquisition. Lymphocytes were gated using FSC vs. SSC dot plot and a region was drawn to encompass the lymphocyte population. LIVE and DEAD lymphocytes were gated using ViaKrome 561 FVD vs. SSC dot plot with the Lymphs gate applied, and gates were drawn to encompass the LIVE (ViaKrome 561 -) and DEAD (ViaKrome 561+) lymphocyte populations.
Data Analysis in the Cytobank Platform
The CytExpert software sample acquisition gating strategy was duplicated in the Gating Editor of the Cytobank platform and positive and negative population peaks were identified using histograms with the appropriate fluorochrome detector selected for the X-axis. (Figure 5).
Sample tags in the Cytobank platform were assigned to each tube to identify antibody concentrations and reagents appropriately. Stain Index (SI) was automatically calculated in the platform by turning on the slider in the Plot menu of the Illustration Editor.
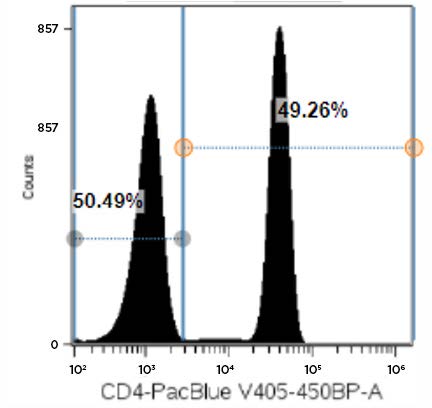
Figure 5. Representative Data Plot of PBMCs Stained with CD4-Pacific Blue Antibody: Single parameter histogram showing CD4-Pacific Blue negative and positive fluorescence peaks derived from a LIVE lymphocytes gate in a PBMC sample stained with 20 µL of antibody.
Results
Antibody titration curves and overlay histogram plots (Figure 6 and Figure 7) were generated for three commonly used flow cytometry markers: CD8, CD19, and CD4. For each antibody, Stain Index (SI) were plotted as a function of antibody concentration. For each antibody, only minimal differences were observed between the recommended antibody concentration (1X) and twice the recommended values (2X). The differences between the 1X concentration and a two-fold dilution (0.5X) varied in an antibodydependent manner, highlighting the reason why optimal antibody concentrations should be determined prior to running complex flow cytometry experiments.
Data with the CD8-APC antibody showed that the 1X and 0.5X antibody concentrations exhibited greatly different SI values. The CD8-APC antibody exhibited an SI value of 245.9 for the 1X concentration but only 146.9 for the 0.5X condition; this represents an approximately 40% reduction in signal. The difference in SI for 1X versus 0.5X with the CD19-AF700 antibody, instead, were more moderate, as reduction of antibody concentration by 50% resulted in a 13% reduction in SI (68.8 for 1X versus 59.9 for 0.5X). For CD4-Pacific Blue, we determined that half of the recommended antibody concentration could be used with only a minimal effect on data quality, as the SI values were 47.9 and 44.0 for the 1X and 0.5X CD4-Pacific Blue antibody concentrations; respectively.
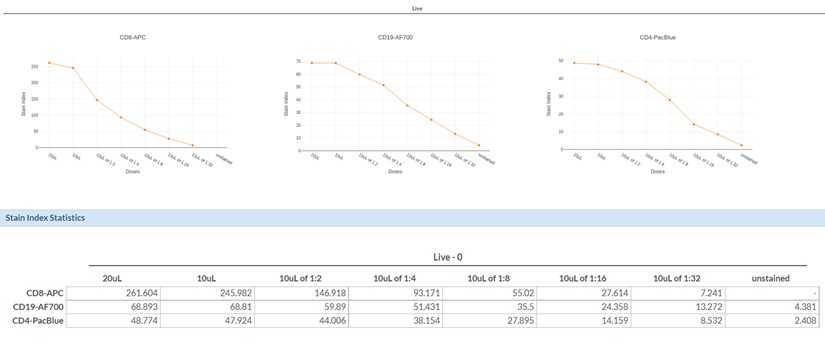
Figure 6. Antibody Titration Curves and Summary Data Tables for CD8-APC, CD19-AF700 and CD4-Pacific Blue Antibodies. Graphs showing Stain Index (SI) vs. antibody volume amount with the actual Stain Index values for each antibody titration displayed below.
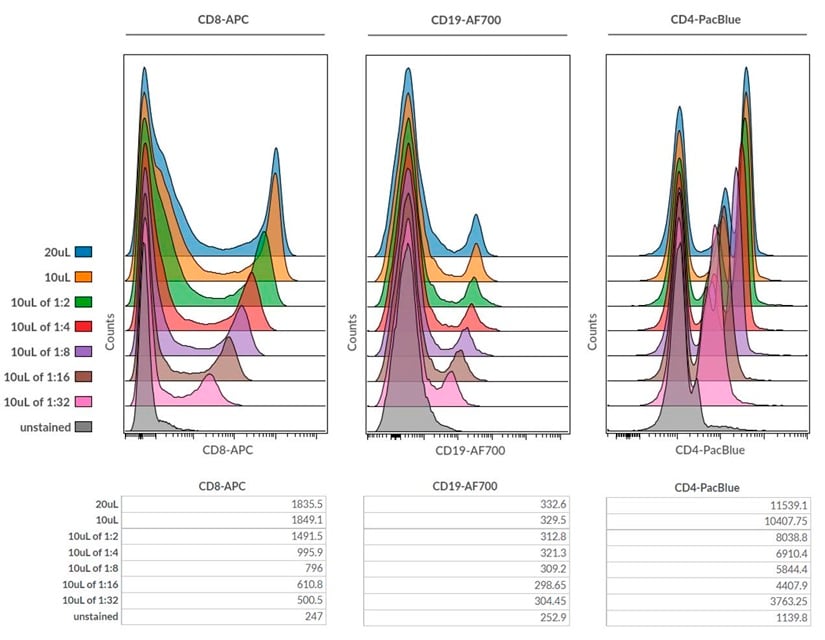
Figure 7. Overlay of single parameter histogram plots for CD8-APC, CD19-AF700 and CD4-Pacific Blue antibody titrations with actual Median Fluorescence Intensities for each antibody titration displayed below.
Dot plots were also generated using concatenated FCS files for each antibody tested (Figure 8). This type of visualization is useful to display positive and negative populations in one single 2D plot and it also visually denotes the spread of the negative population that can occur with increasing amounts of antibody.
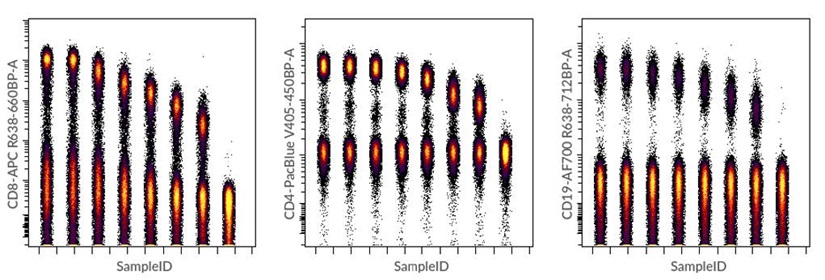
Figure 8. Dot plots created in Cytobank software using concatenated FCS files for CD8-APC, CD19-AF700 and CD4-Pacific Blue antibody titrations. Concatenation of raw FCS files was performed using the FCS File Concatenation tool in the Cytobank Support menu.
For this experiment, we chose the optimal antibody titer volume of 10 µL (1X vendor recommended amount) for each of the three antibodies tested, as this was the amount of antibody that showed best separation between negatives and positive cells as determined by the SI calculation. Table 1 below shows the actual stock antibody concentration (μg/mL) and optimal titer volume (µL) along with the optimal antibody concentration (μg) for the specific lot number of the antibodies tested.
| Antibody | Stock Concentration (μg/mL) | Optimal Titer Volume (μL) | Optimal Titer Concentration (μg) |
| CD4-Pacific Blue | 50 | 10 | 0.5 |
| CD8-APC | 6.25 | 10 | 0.06 |
| CD19-Alexa Fluor 700 | 25 | 10 | 0.25 |
Table 1. Optimal Antibody Titration: Specific antibody lot stock concentration obtained from the Certificate of Analysis document. Optimal antibody titer volume (μL) and concentration (μg) for CD4-Pacific Blue, CD8-APC and CD19-Alexa Fluor 700 for staining PBMCs determined from the automated antibody titration experiment.
Summary
Determining optimal antibody titer amount to use in a given flow cytometry research study is essential for generating high quality data but involves laborious and time-consuming serial dilutions of antibodies and subsequent cell staining steps, which are highly prone to error. Automation of antibody titration steps on the Biomek i7 Multichannel workstation can eliminate or reduce the number of manual processing steps, reduce sources of human error and minimize required user interaction to free up time for operators.
Interpretation of the antibody titration data to determine the optimal titer can be accomplished using several different methods. In the Cytobank platform, one can easily create automatic Stain Index titration curves with a connected Stain Index Statistics table, overlay histograms, and, additionally, one can use concatenated FCS files to create a single 2D dot plot to display the positive and negative populations and to denote the spread of the negative population.
We have demonstrated in this application note a robust and truly walk-away solution for performing antibody titrations with the integration of the CytoFLEX LX flow cytometer with the Biomek i7 Multichannel workstation, both from Beckman Coulter Life Sciences. In addition, we have shown a streamlined data analysis workflow to determine optimal antibody titer amounts using the Cytobank platform, also from Beckman Coulter Life Sciences.
References
- Maecker TH, Frey T, Nomura LE, Trotter J. Selecting fluorochrome conjugates for maximum sensitivity. Cytometry Part A 2004; 62A:169–173.
- Davis BH, Wood B, Oldaker T, Barnett D. Validation of cell-based fluorescence assays: practice guidelines from the ICSH and ICCS, Cytometry B Clin Cytom 2013 84B: 291-308.
